Three different viruses are moving in the same direction at the same time. That convergence — not any single pathogen — is the story Virginia's wastewater data is telling us as we move into late 2026.
Our forecasting models, built on CDC wastewater surveillance data and correlated against regional climate trends, project rising prevalence across SARS-CoV-2, Respiratory Syncytial Virus (RSV), and Influenza A through November and into December. Each follows its own curve. But they are being driven by the same environmental shift, and they will land on the same hospitals.
What the Data Shows
The signal begins with a straightforward environmental observation. Through late September, Virginia saw temperatures fall from roughly 27°C to below 14°C, while the UV index declined from 6.55 to 5.15. Those two variables matter more than they first appear.
Cooler, drier outdoor air increases the environmental stability of enveloped respiratory viruses. Lower UV radiation reduces natural viral degradation on surfaces and in aerosols. And as temperatures drop, populations move indoors — into closer contact, poorer ventilation, and the conditions that accelerate transmission.
The result, across all three pathogens, is the same shape: a late-summer baseline giving way to exponential growth through the autumn.
SARS-CoV-2: A Steady Climb With a Predictable Lag
The correlation between declining temperature, reduced UV radiation, and rising viral copies in wastewater was visible in Virginia's late-September data, and the forecast extends that relationship into the colder months.
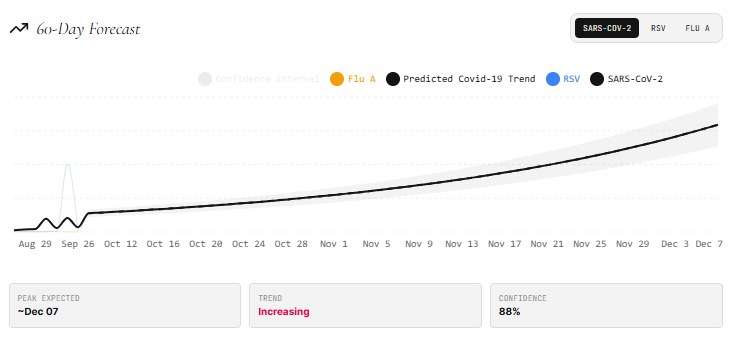
The clinical implication is about timing as much as magnitude. A rising wastewater signal typically leads clinical case reports by 7 to 14 days. That lead time is the entire value of wastewater surveillance — it is a window in which preparation is still possible.
By mid-November, the forecast projects a surge in respiratory-related hospital admissions, with pressure on ICU capacity and emergency department wait times. Primary care will absorb a concurrent increase in diagnostic testing and outpatient management — at the same time as influenza is climbing.
RSV: The Pediatric Pressure Point
RSV's pattern is seasonal to the point of being almost predictable, and Virginia's data fits the norm: sporadic detections through late September, typically in the 0 to 1 copies/mL range, signalling the onset of community transmission rather than its absence.
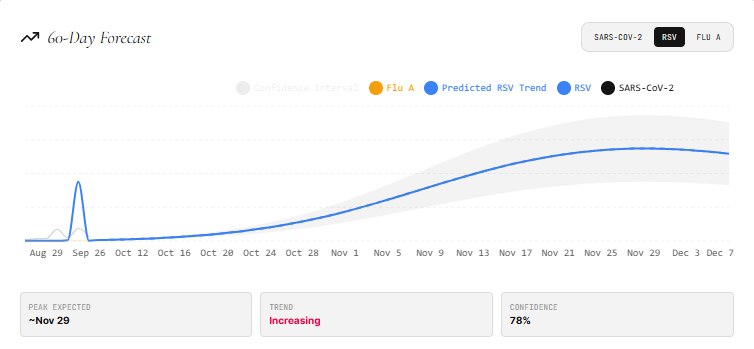
The environmental conditions are especially favourable this year. Temperatures fell from roughly 26°C to 13°C while relative humidity held high, between 60 and 80 percent. RSV shows enhanced environmental stability and aerosol transmission efficiency in exactly that combination — cooler temperatures with moderate-to-high humidity.
The clinical consequence falls hardest on the youngest patients. A rapid rise in pediatric hospitalizations and emergency department visits is projected, particularly among infants under 12 months. Secondary effects follow: pressure on geriatric wards, where RSV causes severe illness in older adults, and potential shortages of specialized pediatric nursing staff as community transmission peaks.
Influenza A: The Steepest Curve
Influenza A moves from a low seasonal baseline into rapid growth across October and November, driven by the same temperature decline — 26.1°C down to 13.6°C — with humidity ranging from 60 to 97 percent supporting droplet persistence.
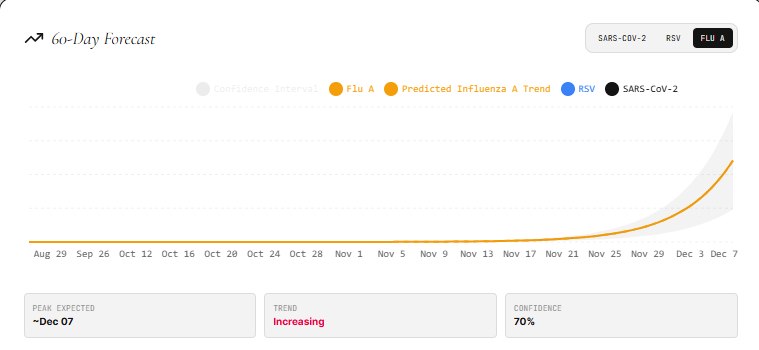
Wastewater detection has historically preceded influenza caseload surges by approximately 10 to 14 days, and this season's early signal is consistent with a standard Northern Hemisphere onset, arriving earlier than many systems will be staffed for.
The projected burden is substantial. By mid-November, regional hospitals should expect increased emergency department visits and outpatient respiratory consultations. Pediatric and geriatric wards are projected to approach 85 percent capacity by early December. Beyond the direct clinical load, expect healthcare worker absenteeism to compound the problem, alongside rising demand for point-of-care testing and antivirals.
The convergence is the risk. Any one of these viruses would be manageable on its own. Arriving together — with overlapping peak windows, competing for the same beds, the same staff, and the same antiviral supply chain — is what strains a regional health system past its margin.
What We Recommend
The value of a forecast lies entirely in what it changes. Based on the projected trajectories, Tambo Consulting recommends Virginia health authorities and provider organizations act on the following before the signal becomes a surge:
Staffing and capacity. Initiate staffing contingency plans for late Q4 now. This includes pediatric intensive care surge planning and a review of float and on-call structures ahead of the mid-November window. Reallocating staff after admissions rise is materially harder than planning before they do.
Supply and therapeutics. Increase PPE inventory, with specific attention to N95 respirators, and ensure a 90-day supply of antivirals including Oseltamivir. Stockpile Palivizumab and Nirsevimab for high-risk neonates ahead of the RSV peak.
Vaccination. Launch high-volume influenza vaccination campaigns now, with the goal of achieving peak population immunity before the projected mid-November surge. Pair this with a robust COVID-19 booster campaign to blunt the December peak.
Infection control. Implement universal masking in healthcare settings and high-risk congregate living facilities beginning November 1st. For neonatal and pediatric wards, we recommend mandatory masking for staff and visitors. Public-facing clinics should increase PPE inventory in anticipation of high-volume respiratory triaging.
Public guidance. Consider public masking advisories for high-risk indoor settings in early November, issued early enough to shape behaviour before transmission accelerates.
How This Forecast Was Produced
Transparency about method matters as much as the projection itself. This forecast was generated using Tambo Consulting's BioGuard surveillance platform, which combines publicly available CDC wastewater surveillance data with regional climate indicators and epidemiological modelling.
The approach correlates declining temperature and UV radiation with observed changes in wastewater viral concentrations, then projects forward using historical seasonal relationships — including the well-documented lag between environmental signal and clinical presentation. It is a model output, and models are tools for preparation rather than prediction of certainty.
What gives wastewater-based forecasting its value is not precision. It is lead time. A signal that arrives a week or two before the caseload is a signal you can still act on.
The BioGuard Surveillance Dashboard tracks wastewater pathogen trends across the DMV and Mid-Atlantic in real time — built by Tambo Consulting.
View Live Dashboard →A note on scope. This article presents a model-based forecast and professional recommendations from Tambo Consulting LLC. It is not official public health guidance. Clinical and operational decisions should be made alongside your local and state health authorities, and forecasts should be updated as new surveillance data becomes available.